
October 2016 Recap by John Nowak
Submitted by Moller Financial Services on October 31st, 2016
Like the Election, Markets Turned Negative in October
While the daily volatility dampened in October, most indexes had a negative return for the month. U.S. stocks, bonds, commodities, gold, REITs, and international stocks all saw their prices decline. Emerging market stocks was the single area in which we invest that had a positive return for the month. This high degree of correlation among asset classes is not normal, but what is these days? The Chicago Cubs and Cleveland Indians competed in the World Series after having gone a combined 174 years without a baseball championship. This presidential election’s two major party nominees have a combined unfavorable rating of 112% (59% Trump and 53% Clinton) just one week before the general election. Perhaps this presidential pessimism is seeping its way into the markets. The American Association of Individual Investors recently measured bullish sentiment at just 25% compared to 38% on average, and investor flows out of equity funds have increased in recent months. While the election has been driving the news (and possibly influencing investors) for some time, there are reasons for optimism.
Bulls and Bears ≠ Donkeys and Elephants
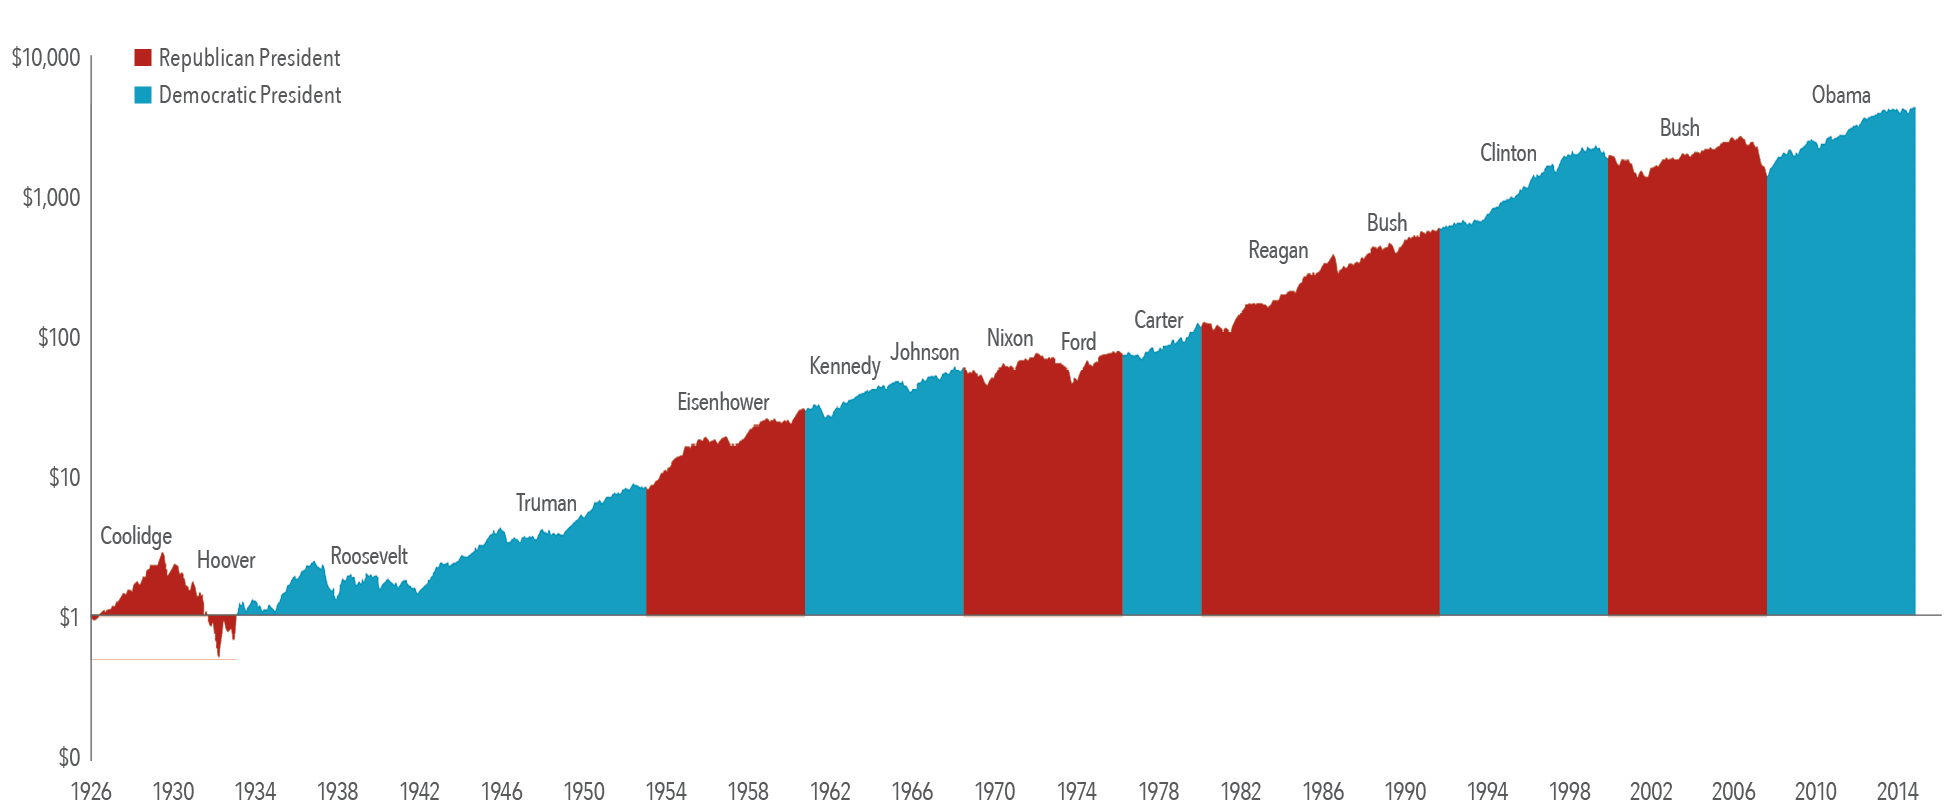
Predictions about presidential elections and the stock market often focus on which party or candidate will be “better for the market” over the long run. The chart below shows the growth of one dollar invested in the S&P 500 Index over nine decades and 15 presidencies (from Coolidge to Obama). This data does not suggest an obvious pattern of long-term stock market performance based upon which party holds the Oval Office. The key takeaway here is that over the long run, the market has provided substantial returns regardless of who controlled the executive branch. (Source: Dimensional Fund Advisors LP.)
|
Growth of a Dollar Invested in the S&P 500, January 1926–June 2016
Past performance is not a guarantee of future results. Indices are not available for direct investment; therefore, their performance does not reflect the expenses associated with the management of an actual portfolio. The S&P data is provided by Standard & Poor’s Index Services Group. |
As if 90 years of market returns was not enough, Vanguard went all the way back to 1853 to measure the returns of the U.S. stock market for each party controlling the White House. Their research found that both parties had 11% average annual market returns.
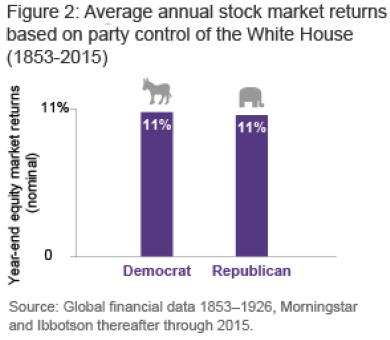
Since studies have shown that the presidential party does not have an impact on long-term returns, we are not concerned about short-term market impact either way. Following an appropriate, disciplined, and patient investment strategy is a best practice no matter who is in the White House.
U.S. Economy, Wages, Housing, and Corporate Earnings Continue Growing
In a busy month of economic reports, the news continues to be positive. Here are some highlights in case you missed them.
U.S. Corporate Earnings Improve: 60% of companies in the S&P 500 have reported earnings. Almost 73% of these companies beat their initial estimates, and less than 20% missed their targets. If these results continue, it will be the third quarter in a row where over 70% of companies beat their earnings estimates. Real Estate is the one sector to underperform their earnings estimates this quarter, likely being responsible for the REIT index decline of nearly 5% for the month.
U.S. Wages Grow: The Atlanta Fed released hourly wage data showing a 4% growth in September compared to last year. This improvement is the highest growth rate since the 2008-2009 recession and could be a sign of improving economic stability for many more Americans. Real wages (after inflation) have not grown much since the mid-1970s, so this increase is positive news.
U.S. Economy Expands: Real Gross Domestic Product (GDP) grew at a 2.9% annualized rate for the third quarter of 2016. This growth rate was the largest in two years. Before people get too excited, these numbers are often revised, and the general trend is more important than the single number. However, after a relatively weak previous three quarters of growth, this is positive news.
We understand that tomorrow’s election results, lame duck period, and first hundred days all present times of uncertainty. There is a saying – don’t let the highs get you too high or the lows get you too low. Developing a plan and investing with a disciplined strategy are the foundations for putting that wisdom into practice for your portfolio. Perhaps more importantly, we are here to help you through the inevitable times of concern and need.