How Long Is "Long Term"? by John Nowak
Submitted by Moller Financial Services on May 4th, 2016
One of the most common sentiments I hear today when it comes to investing is that of frustration with the markets. After all, the global stock market index is at the same level as it was two years ago (April 2014 to April 2016), but with a lot of ups and downs. I understand and join you in frustration! Two years can seem like a long time to wait for the reward of investing with a disciplined and diversified plan. However, two years is not very long when we speak of “long-term investing”. So how long is “long-term” anyway?
Before answering that, let’s review the performance for large U.S. company stocks (S&P 500) over some recent timeframes as of April 30, 2016.
- 1.7% = total return year-to-date
- 1.2% = annual return over last year
- 11.0% = annual return over last five years
- 6.9% = annual return over last 10 years
- 5.5% = annual return over last 15 years
- 7.9% = annual return over last 20 years
- 10.0% = annual return over last 90 years
As you can see, how an investor may feel about the market can depend on when they start looking. For those who started investing in April 2011, the world is a great place – 11% annual return is pretty good! However, investors looking at anything other than the most recent five-year period may be disappointed. This disappointment could lead to frustration and eventually giving up on their long-term plan. In this way, frustration is just as bad as other detrimental investor behaviors like fear, greed, and complacency. Being aware of these feelings is good, but acting on them usually is not.
Anchored Expectations
If all of the above periods have positive returns, why do some people feel frustrated? The number one reason is because expectations for stock returns are typically anchored to the 90-year annualized return of 10% per year. “Anchoring” is a nerdy behavioral finance term that describes how people make decisions based on their first piece of information. For example:
- Have you ever not sold a stock because its price was below what you paid for it? The price has to come back, right? Anchoring.
- Have you ever not purchased an item because you saw it on sale just a month earlier? Why pay more than you should? Anchoring.
Being anchored to a 10% annual return can lead to disappointment and frustration when the last year, 10-year, 15-year, and 20-year market returns are all lower than the 90-year average. Who has another 70 years to wait in order to earn the long-term average annual return of 10%?
Overcoming the 10% Anchor
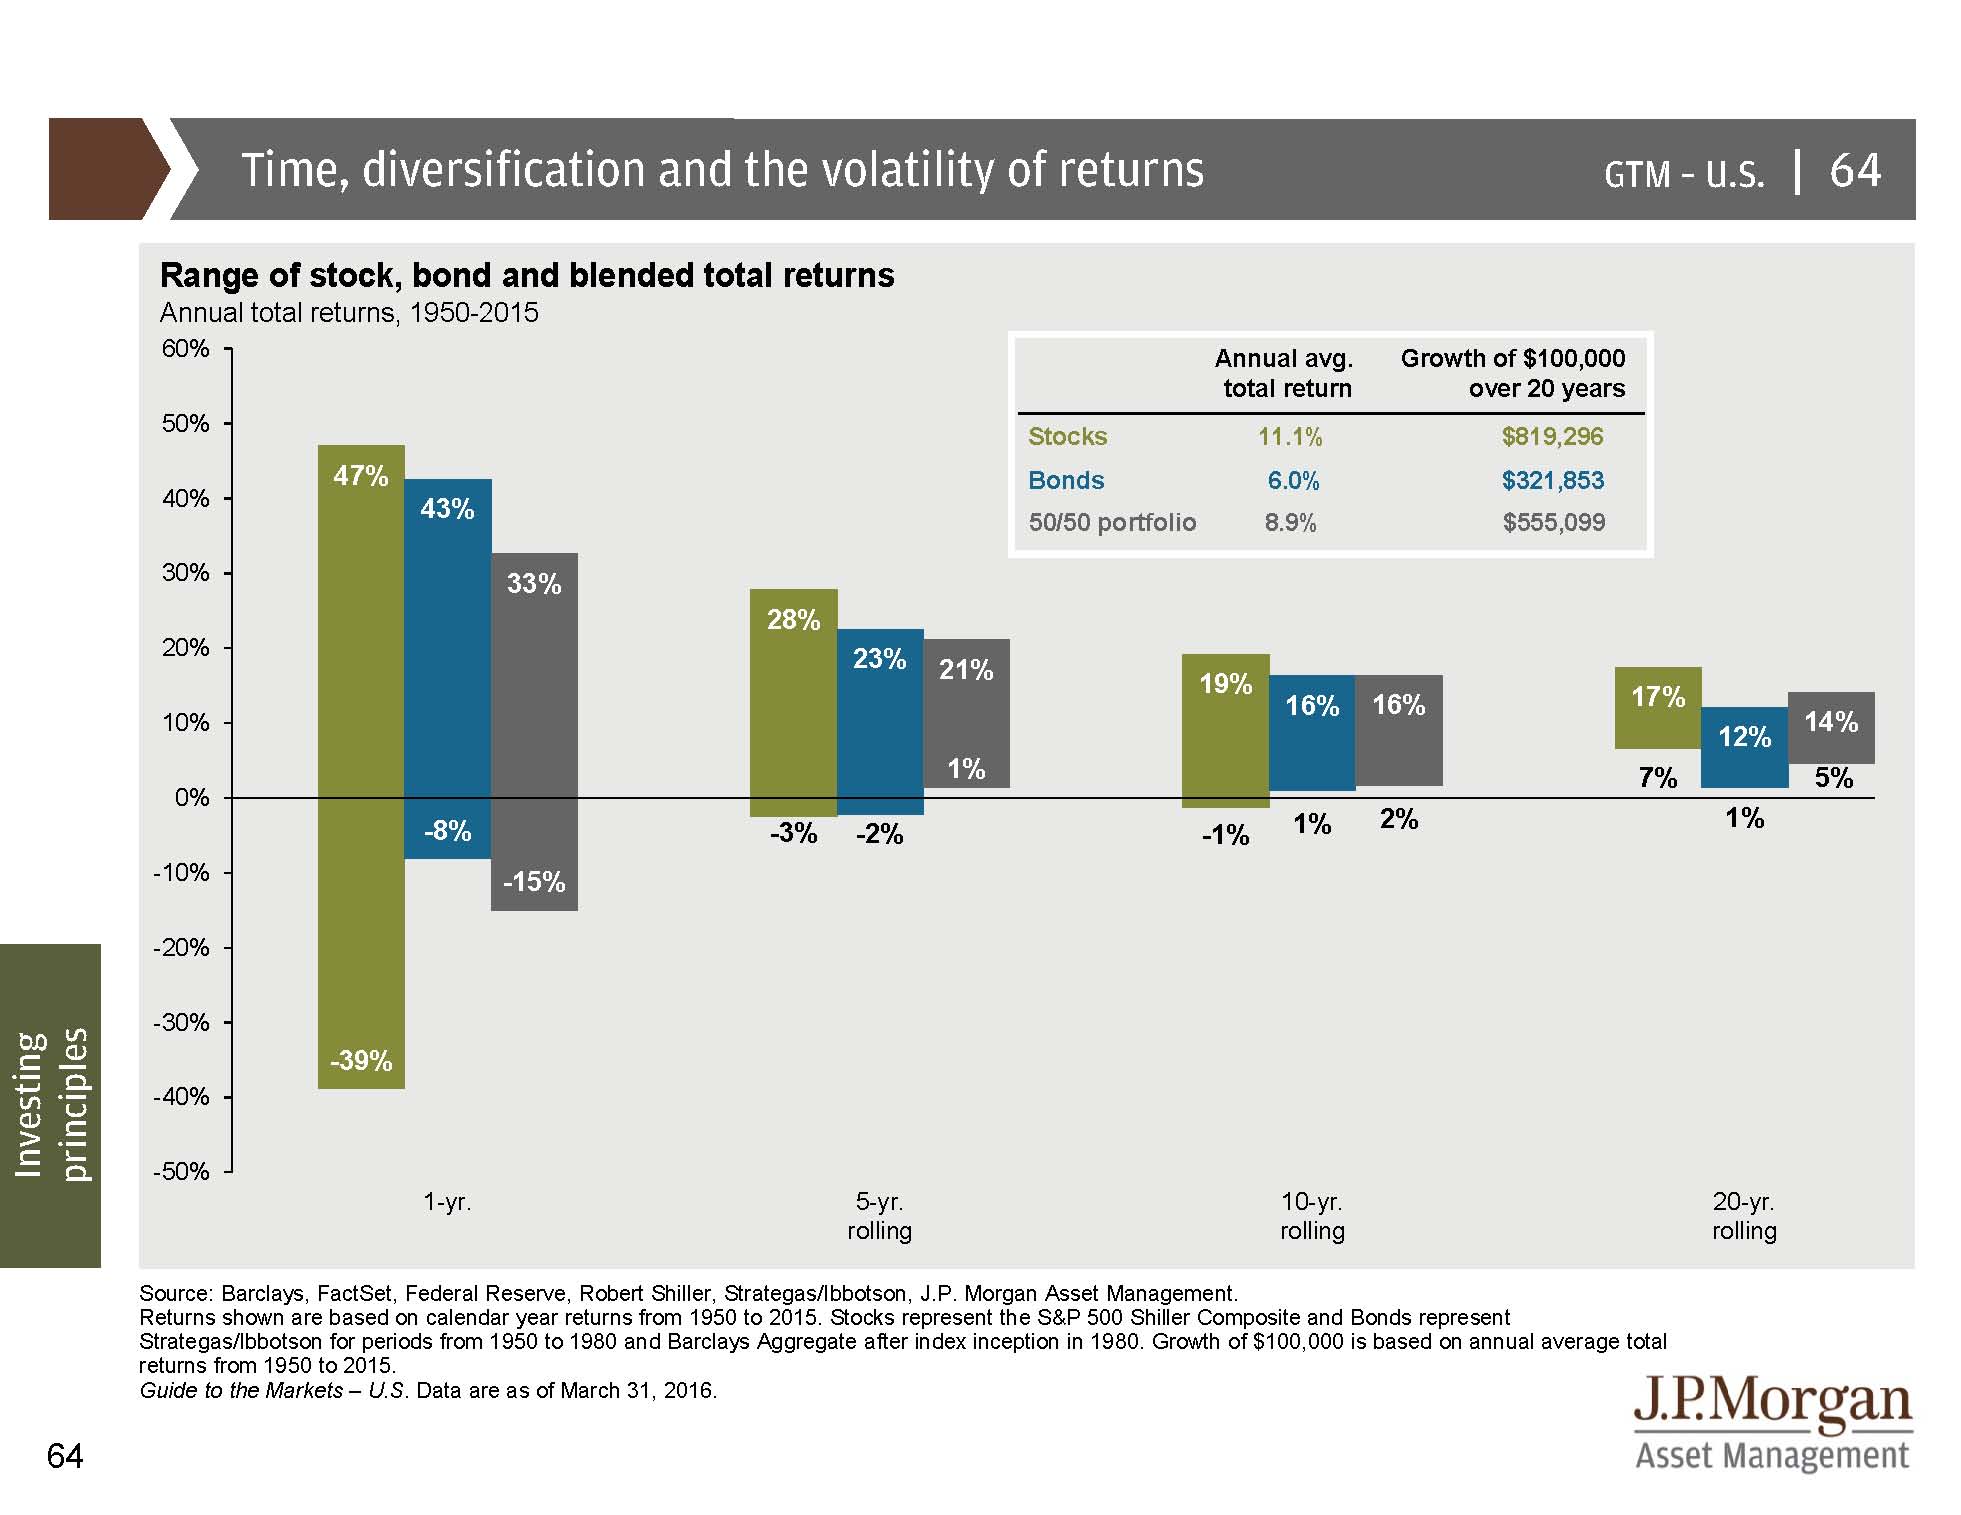
The way I have overcome this 10% annual return anchor and improved my perspective for long-term investing comes from the following chart from JPMorgan Asset Management: “Time, diversification and the volatility of returns”. This chart shows the range of returns for different investment periods back to 1950 for stocks and bonds. While the annual average return for stocks during this period was 11.1%, you can see that even over 20-year periods the annual return for stocks can range from 7% to 17%. This is a huge difference when compounded over 20 years (almost six times more total growth for the higher return).
They say a picture is worth a thousand words. Four conclusions and 87 words come to my mind after reviewing this chart. Most investors will be better off by committing these to memory or saving in a good place.
- Stock returns over one to five years have a wide range of outcomes, positive and negative.
- Even patient, long-term investors have experienced negative returns over a 10-year period, but only for the periods starting in 1999 and 2000 which included both the dot-com bubble and global financial crisis.
- The range of returns narrows significantly over a 20-year time frame with all historical periods since 1950 having earned 7% annual return or more.
- It is better to focus on a well-prepared plan and execution (what you can control) than an outcome which is out of your control.